

Monitors
In each plug-in, you will find the Monitors tab in the ribbon bar. The various monitors provide you with a quick overview of the status of jobs, clients, server jobs, emails and synchronisations of the file repositories.
Job Monitor
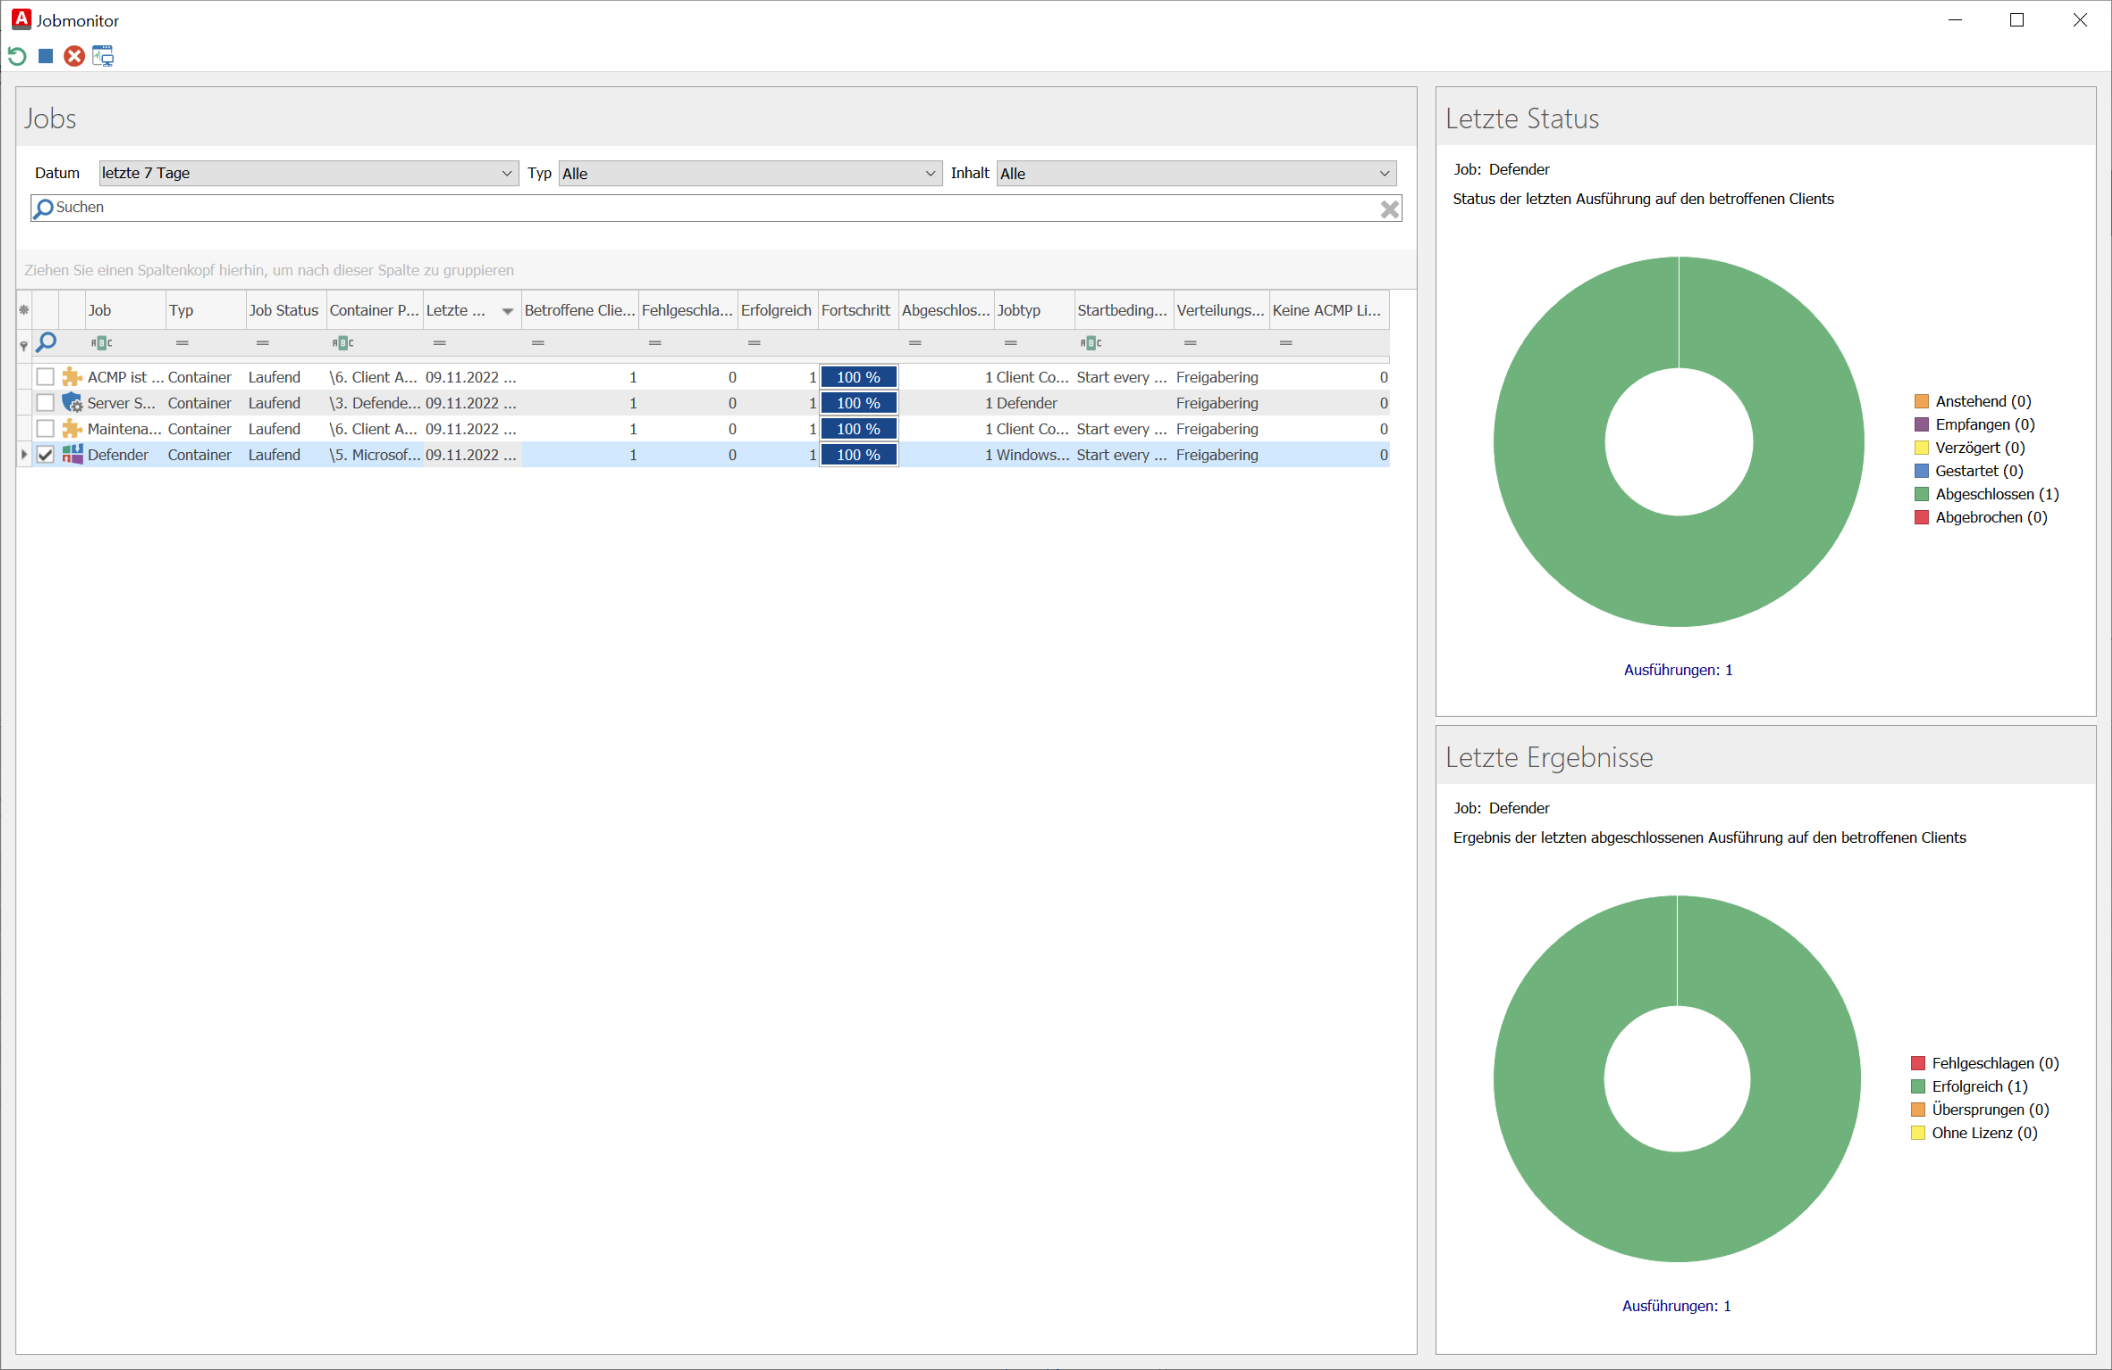
The Job Monitor shows you all the jobs that are pending on your clients, have already been successfully run or have failed.
Job Monitor
In principle, this monitor can be filtered according to three contents:
- Date (All, Today, Yesterday, Last 7 days, Last 14 days, Last 30 days)
- Type of job (kiosk, container, OS installer, pushed, RunCC)
- Content or topic of the respective job (ACMP Agent, ACMP Agent Installation, ACMP Gateway, Client Commands, Defender Management, Intune Action, Job Collection, Managed Software, Manual Agent Job, Rollout, Windows Update, Windows Update Collection).
By default, the results of the last 7 days are filtered.
The individual job executions are listed in the overview. The name of the job and the type are displayed first. The job status gives you a direct overview of the current stage of the job and the container path to which the job belongs. The exact date of the last execution, the number of Clients affected by this job and the number of executions that failed, were successful and are finished are then displayed. The job type reflects the content of the job. In addition, the start condition of the job set in the containers, the distribution ring and the number of possible ACMP licenses imported are displayed.
If you double-click on a job in the job listing, you will get more detailed information about the executions.
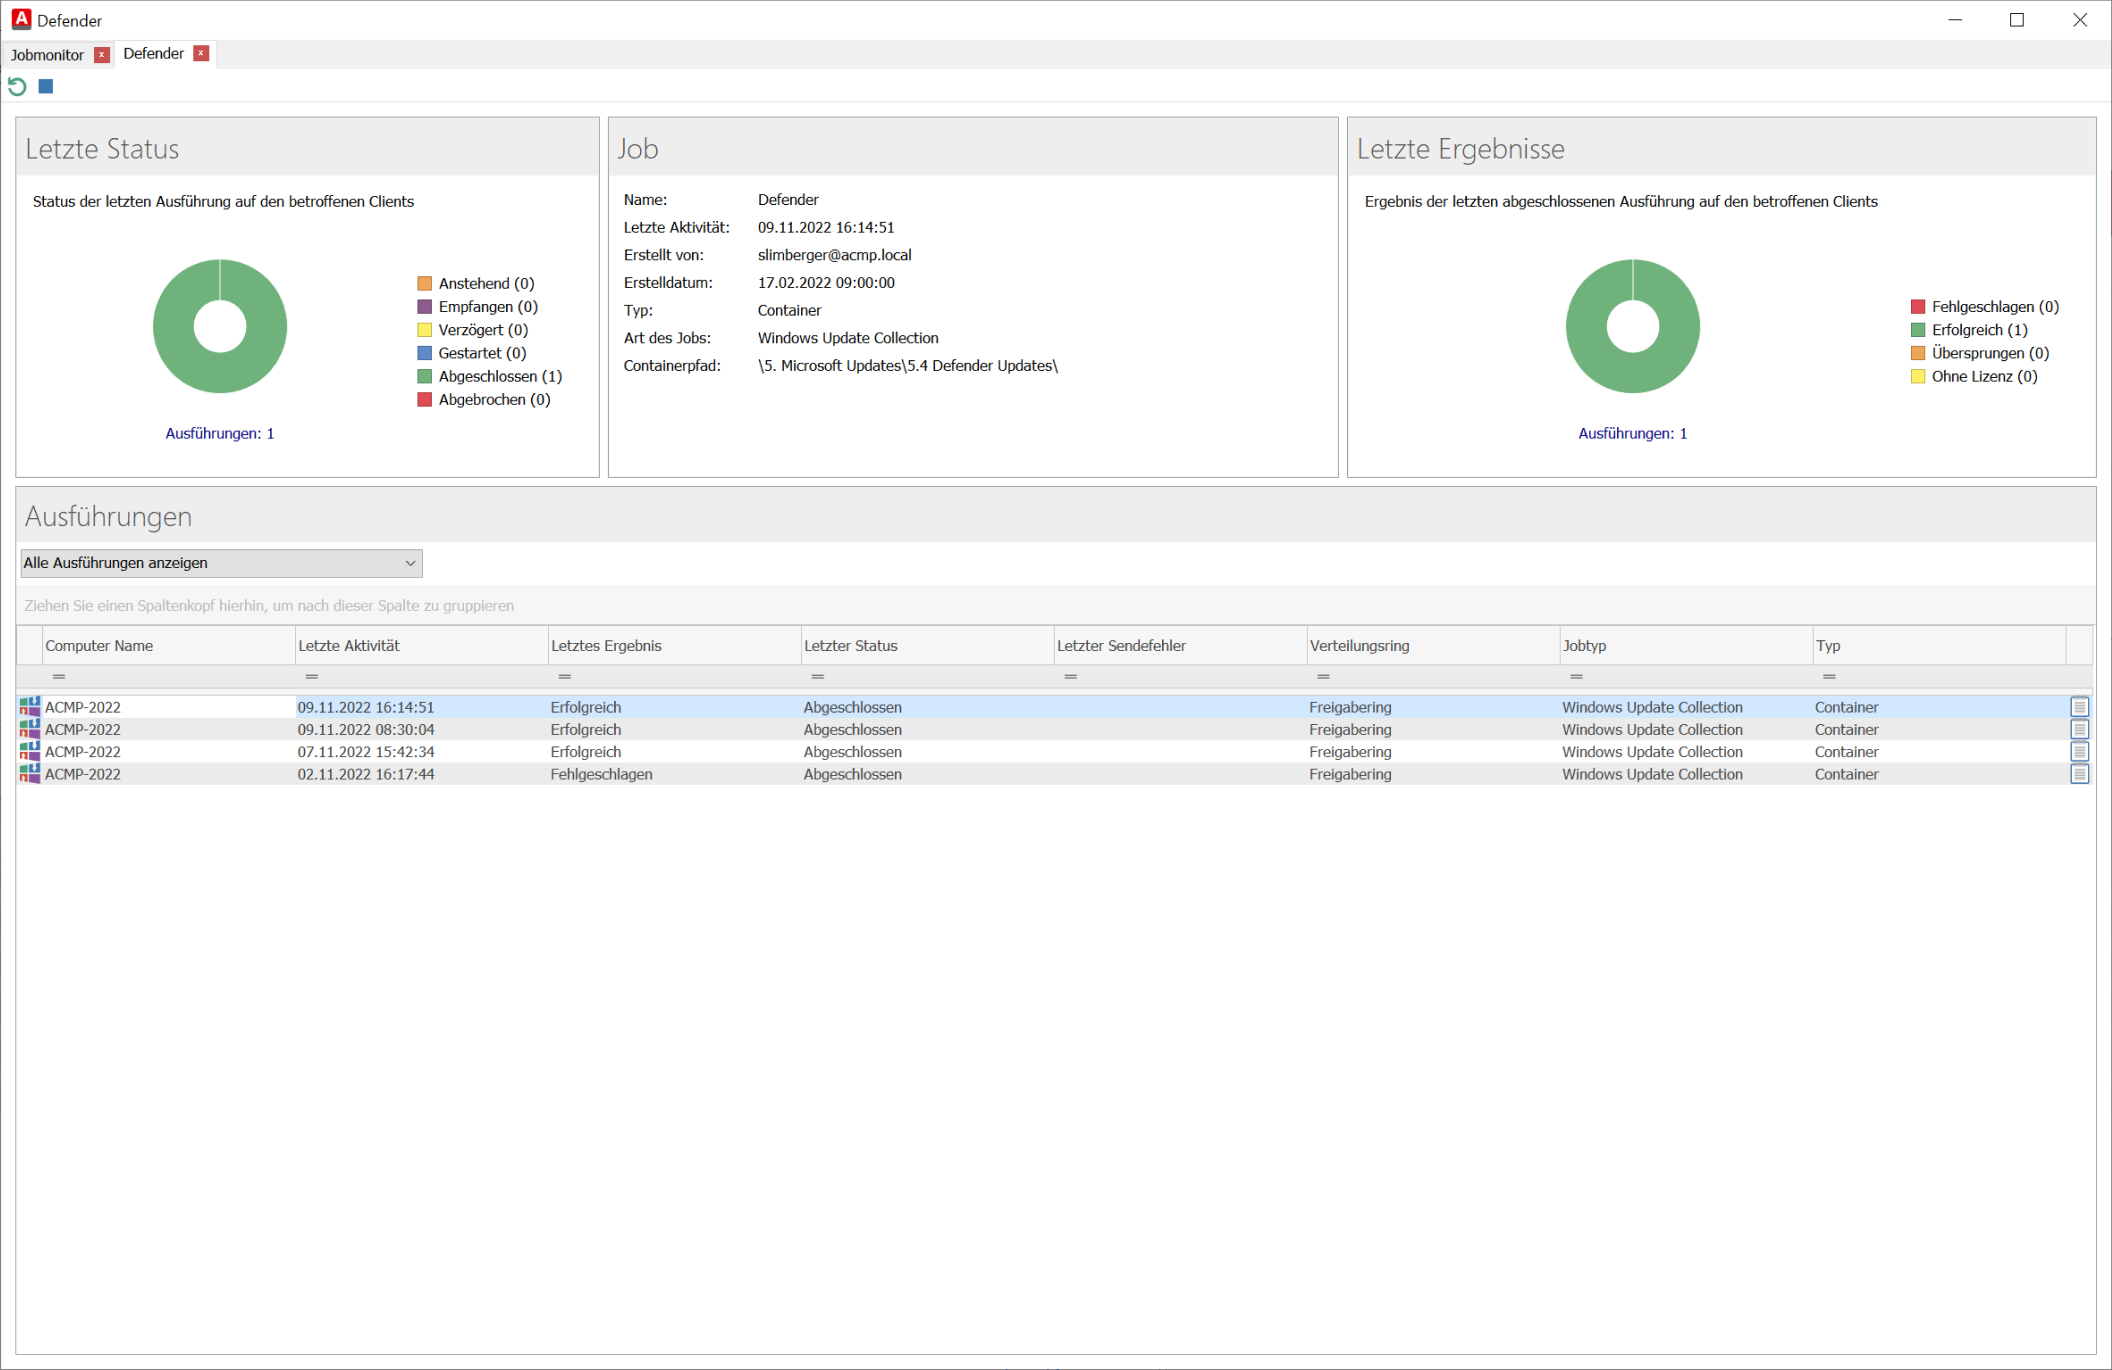
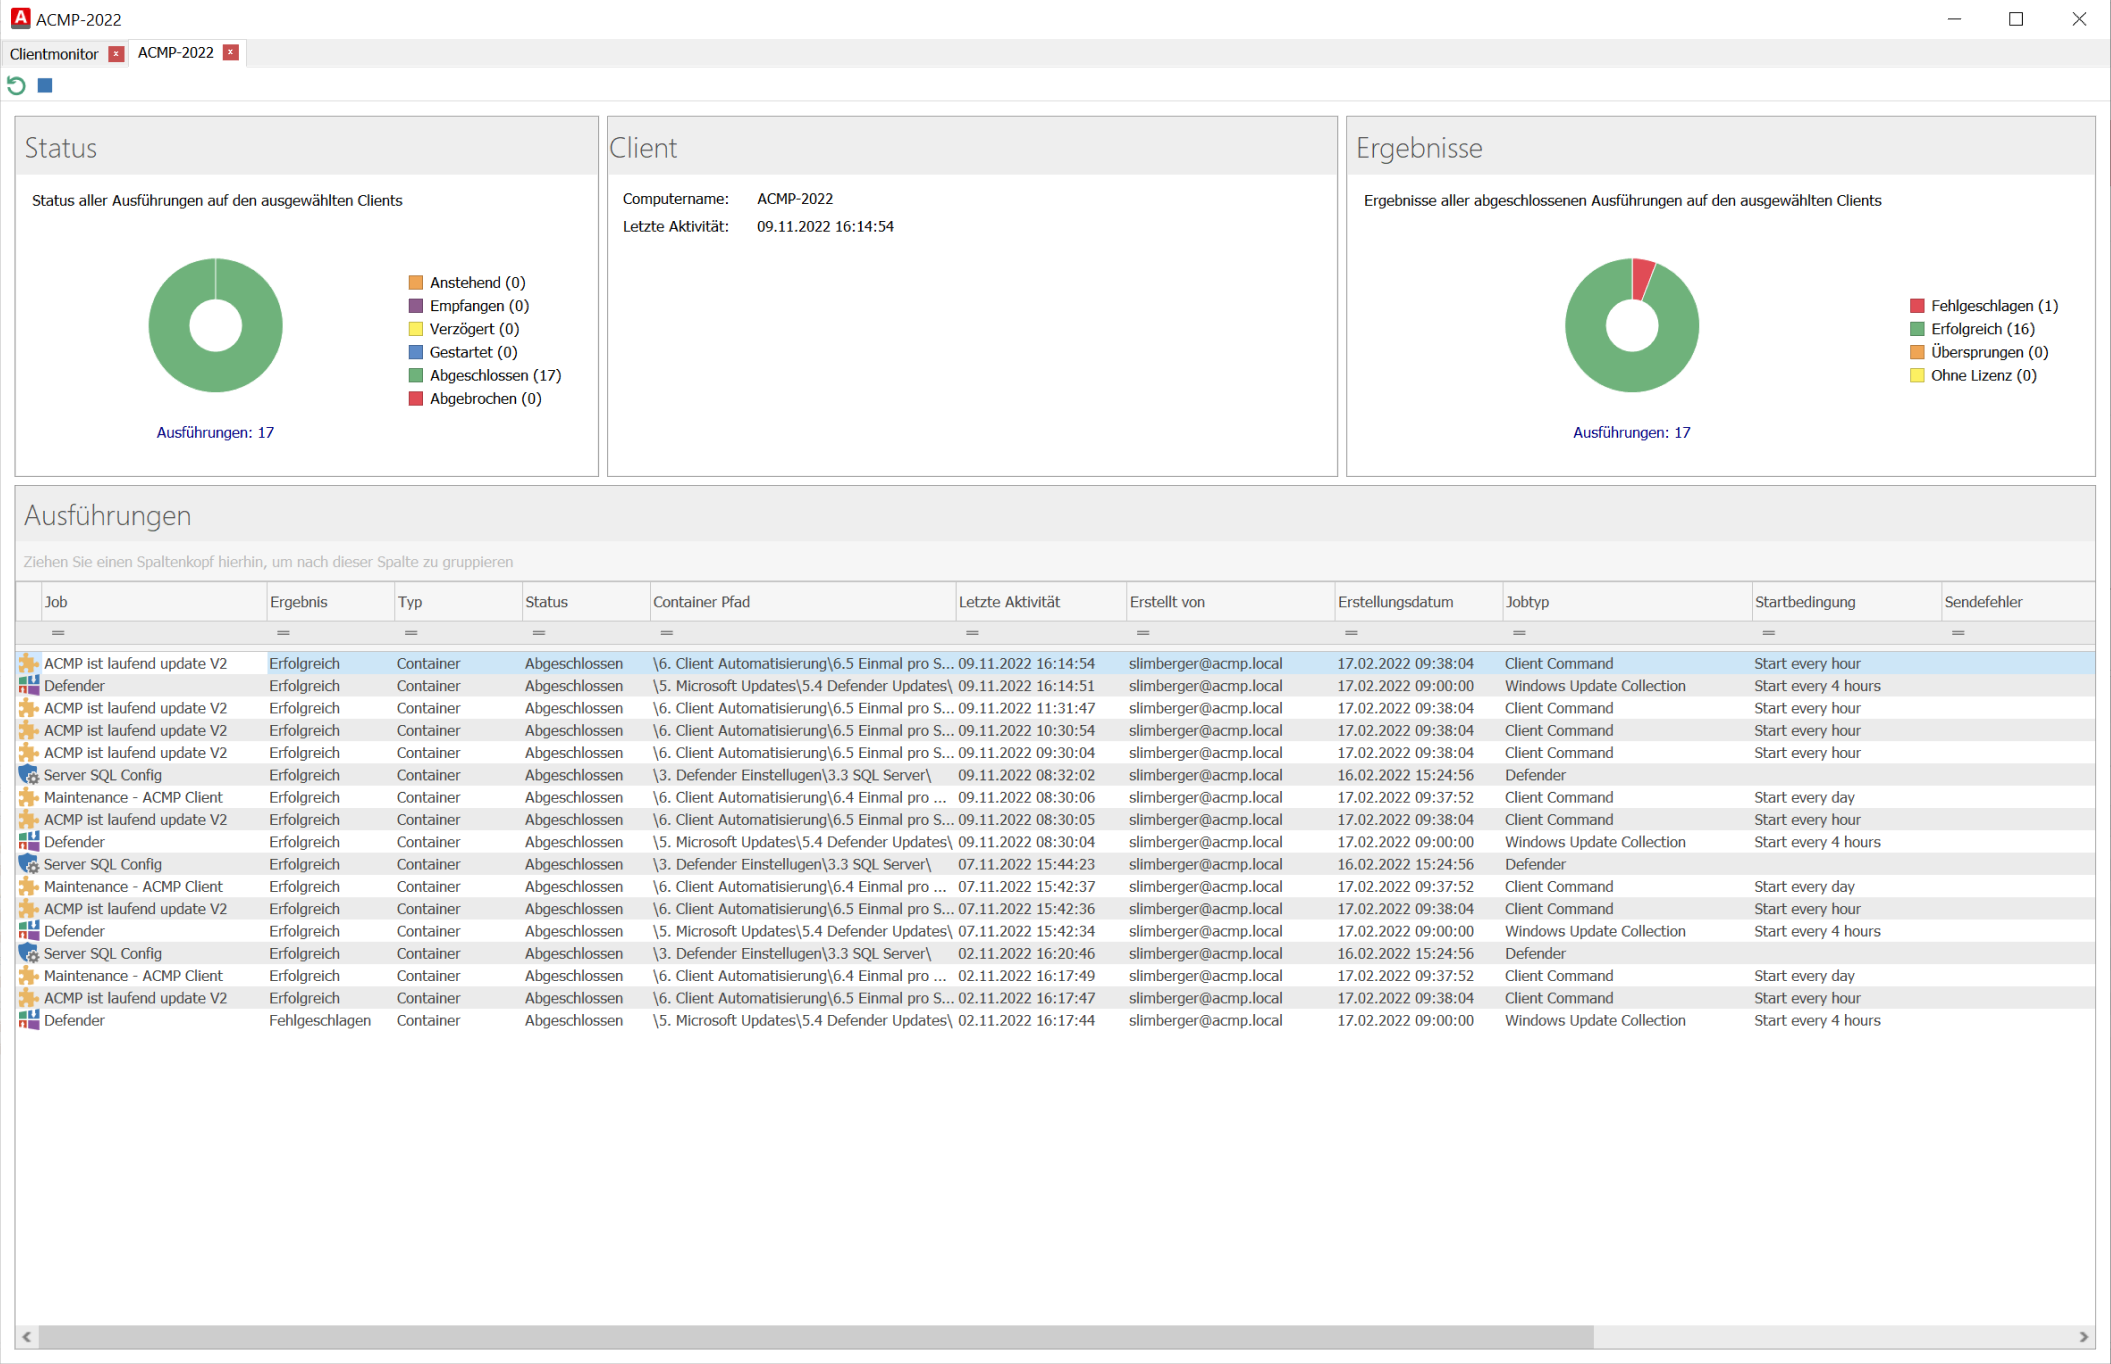
A specific job execution
You will see an overview of how the Default Defender job, for example, was executed on the selected Clients that have been assigned to a Container.
There are 6 statuses:
| Status | Meaning |
| Awaiting | The job has been created and execution is scheduled. |
| Received | The jobs were sent to Clients and received by them. |
| Deplayed | The job received by Clients was postponed by the user to a later point in time. |
| Started | The job received by Clients was started in line with the start conditions and is currently being executed. |
| Finished | The started job has been finished and the results are available. |
| Cancelled | The started job was aborted during execution due to an error or manually by the user. |
This order of statuses is also followed during the execution of a job.
An overview of the results of the jobs on the selected Clients is displayed under Last Results. There are 4 statuses:
| Result | Causes |
| Failed | The job was executed, but the defined actions could not be completed successfully due to one or more errors. |
| Successful | The job has been executed and the defined actions have been successfully carried out. |
| Skipped | The job has been executed and there is no error, but the defined actions have been skipped because the intended target of the action is already present. So it would be possible to carry out the action, but it is not necessary. |
| Without license | The job was executed, but the defined actions could not be successfully completed because one or more of the actions requires a specific ACMP license that you do not have. |
If this job execution has failed, you can click again on the listing to display the log entries with error messages.
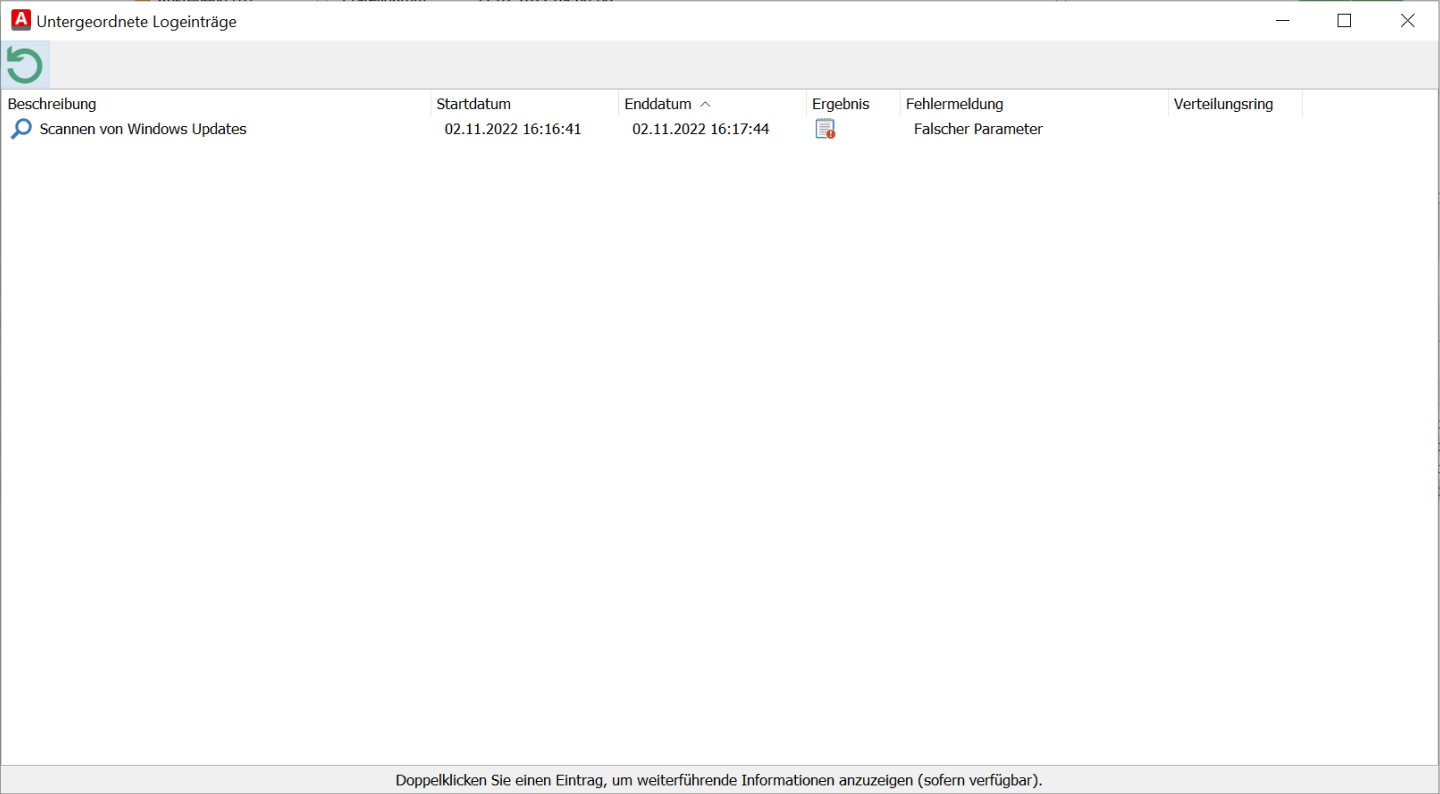
Log entries for a failed job
Client Monitor
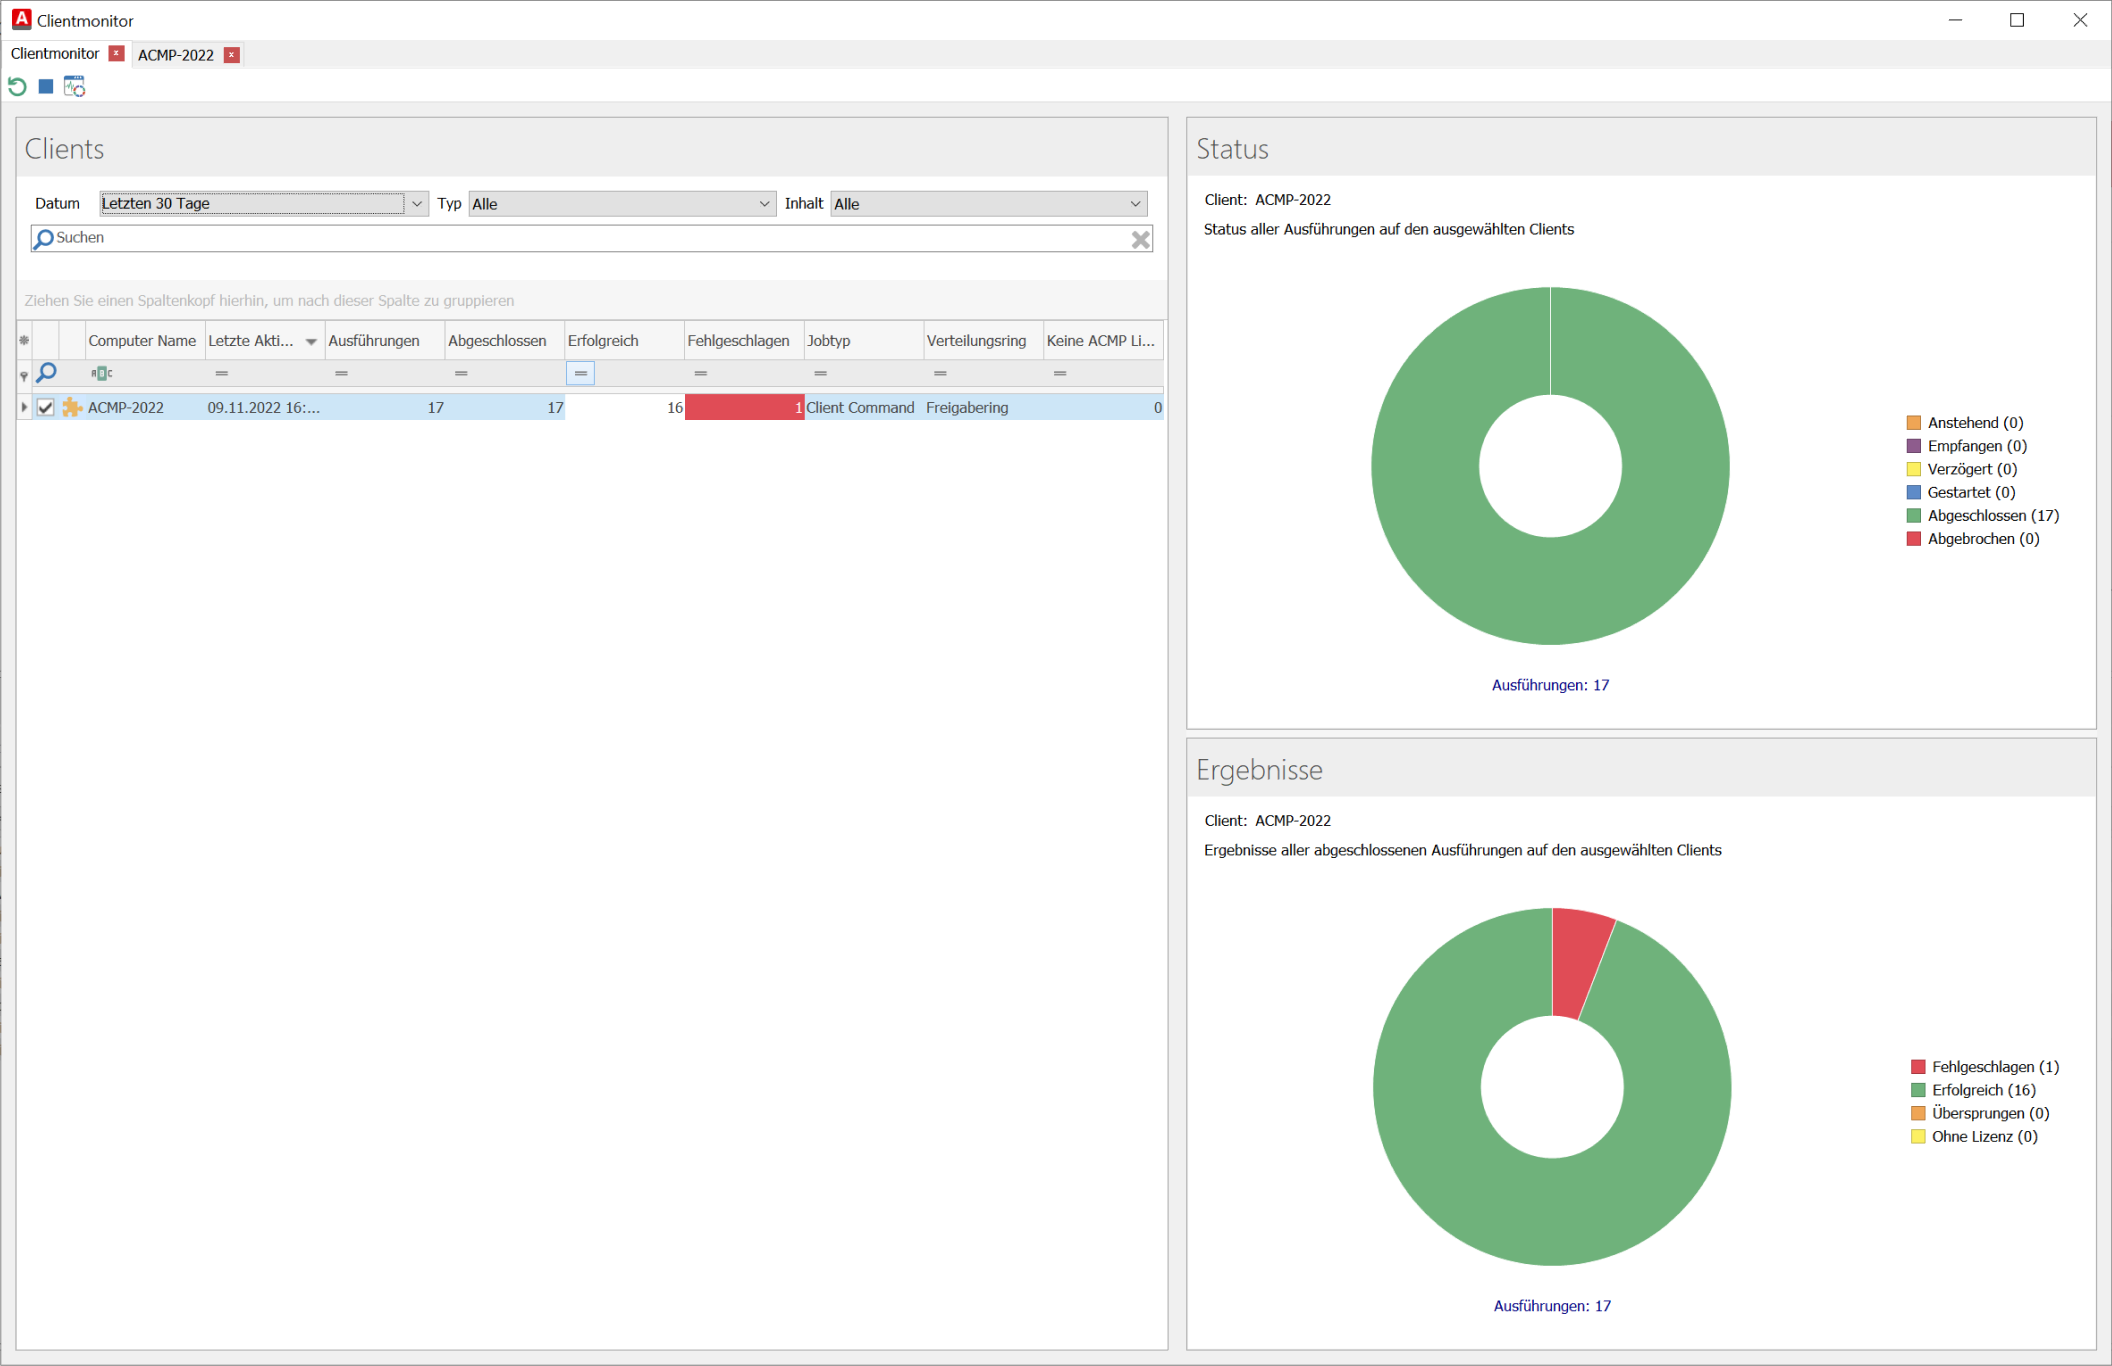
The Client Monitor allows you to view all or selected clients that are to execute or have already executed jobs from the client's point of view.
Client Monitor
In principle, this monitor can be filtered according to 3 contents:
- Date (All, Today, Yesterday, Last 7 days, Last 14 days, Last 30 days)
- Type of job (Kiosk, Container, OS Installer, Pushed, RunCC)
- Content or subject of the respective job (ACMP Agent, ACMP Agent Installation, ACMP Gateway, Client Commands, Defender Management, Job Collection, Managed Software, Manual Agent Jobs).
By default, the results for the last 7 days are filtered.
Each client is listed in the summary. Firstly, the computer name and the exact date of the last execution on the client are displayed. This is followed by the number of previous executions on the client, including completed, successful and failed. It also shows the type of job that was run on the client, the associated distribution ring in which the job was started and any associated ACMP licence.
Double-clicking on a client in the list will give you an overview of how, for example, the Default Defender job was run on the selected clients.
All executions of a single Client
There are 6 statuses:
| Status | Meaning |
| Awaiting | The job has been created and execution is scheduled. |
| Received | The jobs were sent to Clients and received by them. |
| Deplayed | The job received by Clients was postponed by the user to a later point in time. |
| Started | The job received by Clients was started in line with the start conditions and is currently being executed. |
| Finished | The started job has been finished and the results are available. |
| Cancelled | The started job was aborted during execution due to an error or manually by the user. |
This order of statuses is also applied during the execution of a job on the client.
An overview of the results of the jobs on the selected clients is displayed under Last Results. There are 4 statuses:
| Result | Causes |
| Failed | The job was executed, but the defined actions could not be completed successfully due to one or more errors. |
| Successful | The job has been executed and the defined actions have been successfully carried out. |
| Skipped | The job has been executed and there is no error, but the defined actions have been skipped because the intended target of the action is already present. So it would be possible to carry out the action, but it is not necessary. |
| Without license | The job was executed, but the defined actions could not be successfully completed because one or more of the actions requires a specific ACMP license that you do not have. |
If this client execution has failed, you can double-click the entry again in the list to display the log entries with error messages.
Log entries for failed client jobs
Server Monitor
The Server Monitor provides you with an overview of the tasks that the server performs in the background.
These server jobs include background processes, e.g. calculations of which Clients are dynamically assigned to which container, cleanup of old WUM logs or updates of MSW packages.
Most of the tasks can be found in the scheduled server tasks; however, some other background processes are also listed that cannot be found and controlled in the settings. Scheduled server tasks can also be executed manually from the server monitor.
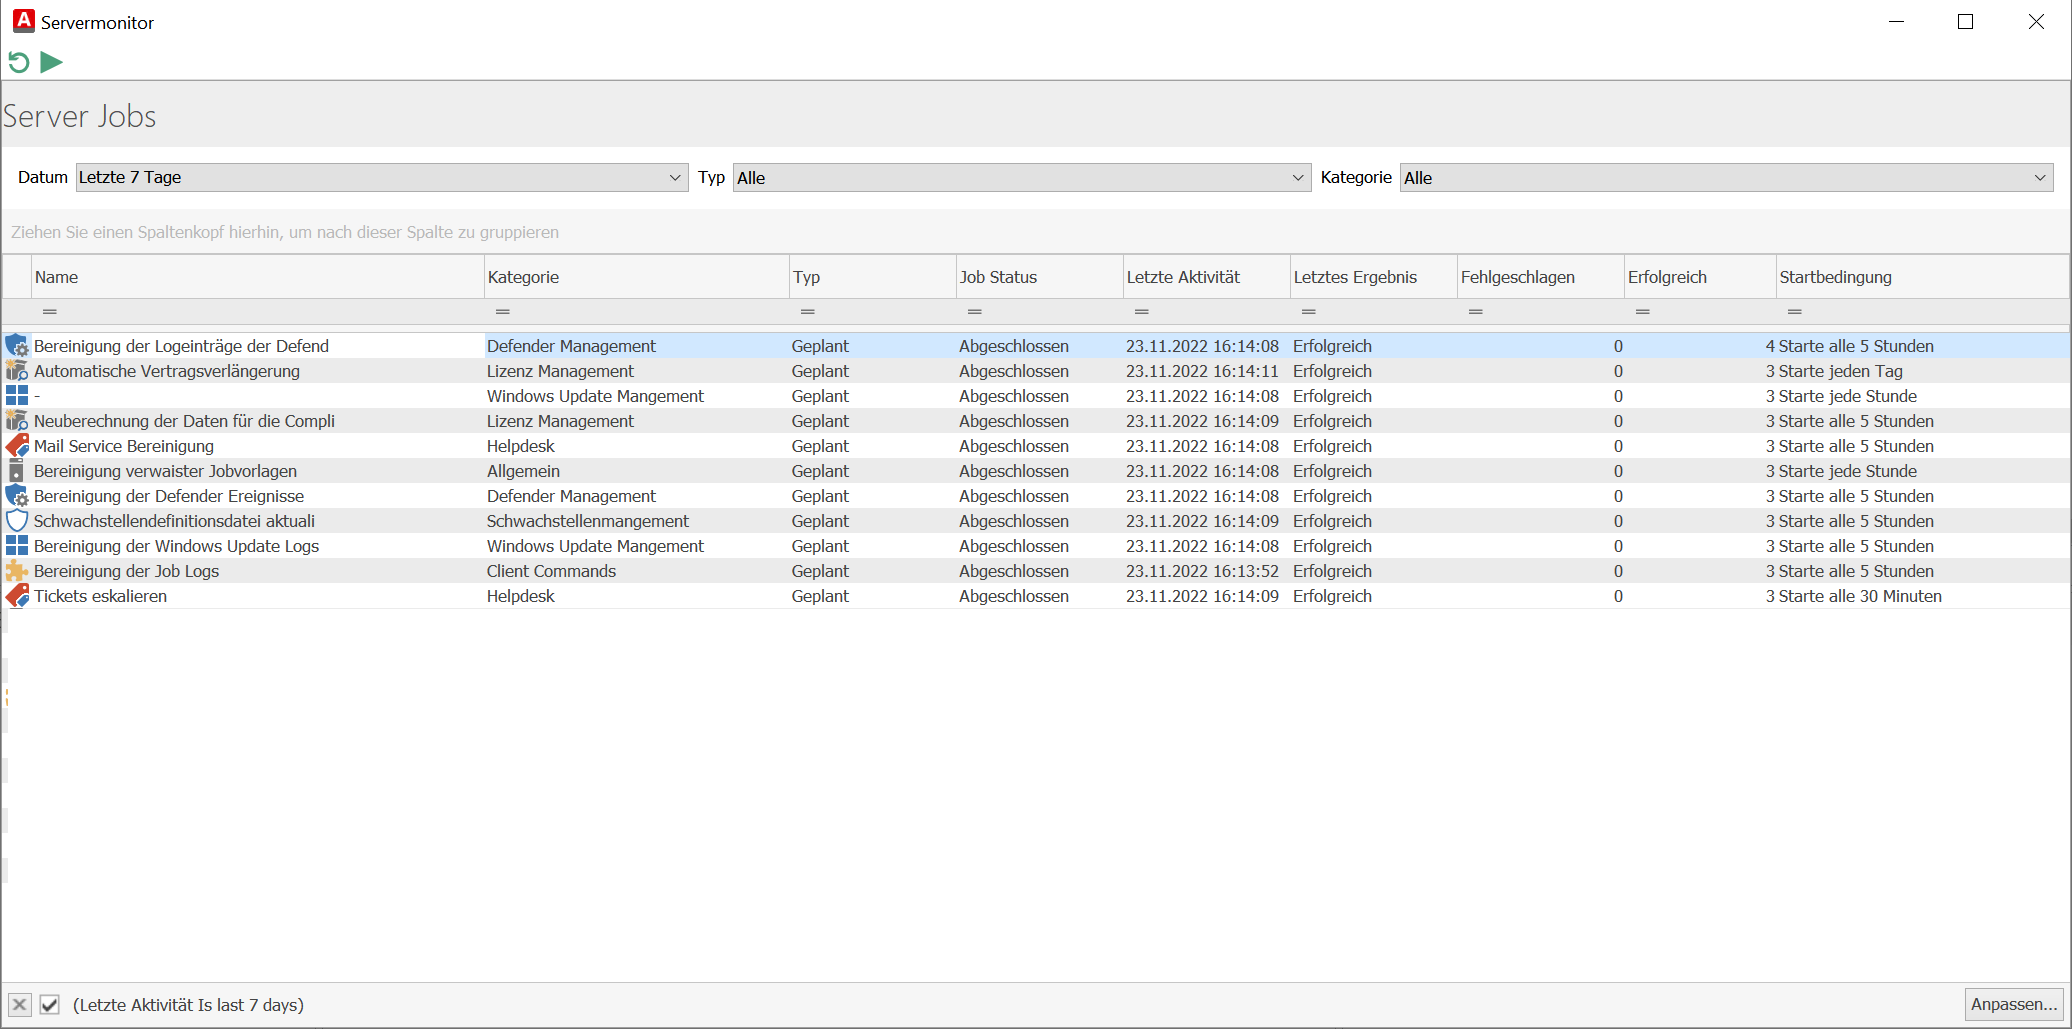
Server Monitor
In principle, this monitor can be filtered according to three contents:
- Date (All, Today, Yesterday, Last 7 days, Last 14 days, Last 30 days)
- Type of job (All, Planned, Manual)
- Category of the respective server job (General, Defender Management, Client Commands, Helpdesk, Licence Management, Vulnerability Management, Windows Update Management, Managed Software).
By default, the filter shows results from the last 7 days.
The individual job descriptions are listed in the overview. Each job is assigned to a category that corresponds to the categories of the planned server tasks. The type indicates how the job was executed: planned or executed manually. The job status shows you the current status of the execution: running or finished. The last result shows you the result of the last execution, whether the execution was successful or failed. Then the total number of scheduled executions is displayed and how many of them have been successful or failed. The start condition shows you the interval at which the server job is executed.
You can get an overview of the executions of a particular job by double-clicking on a job. In addition to general job information and a status chart, all executions of this job in the last 30 days are displayed.
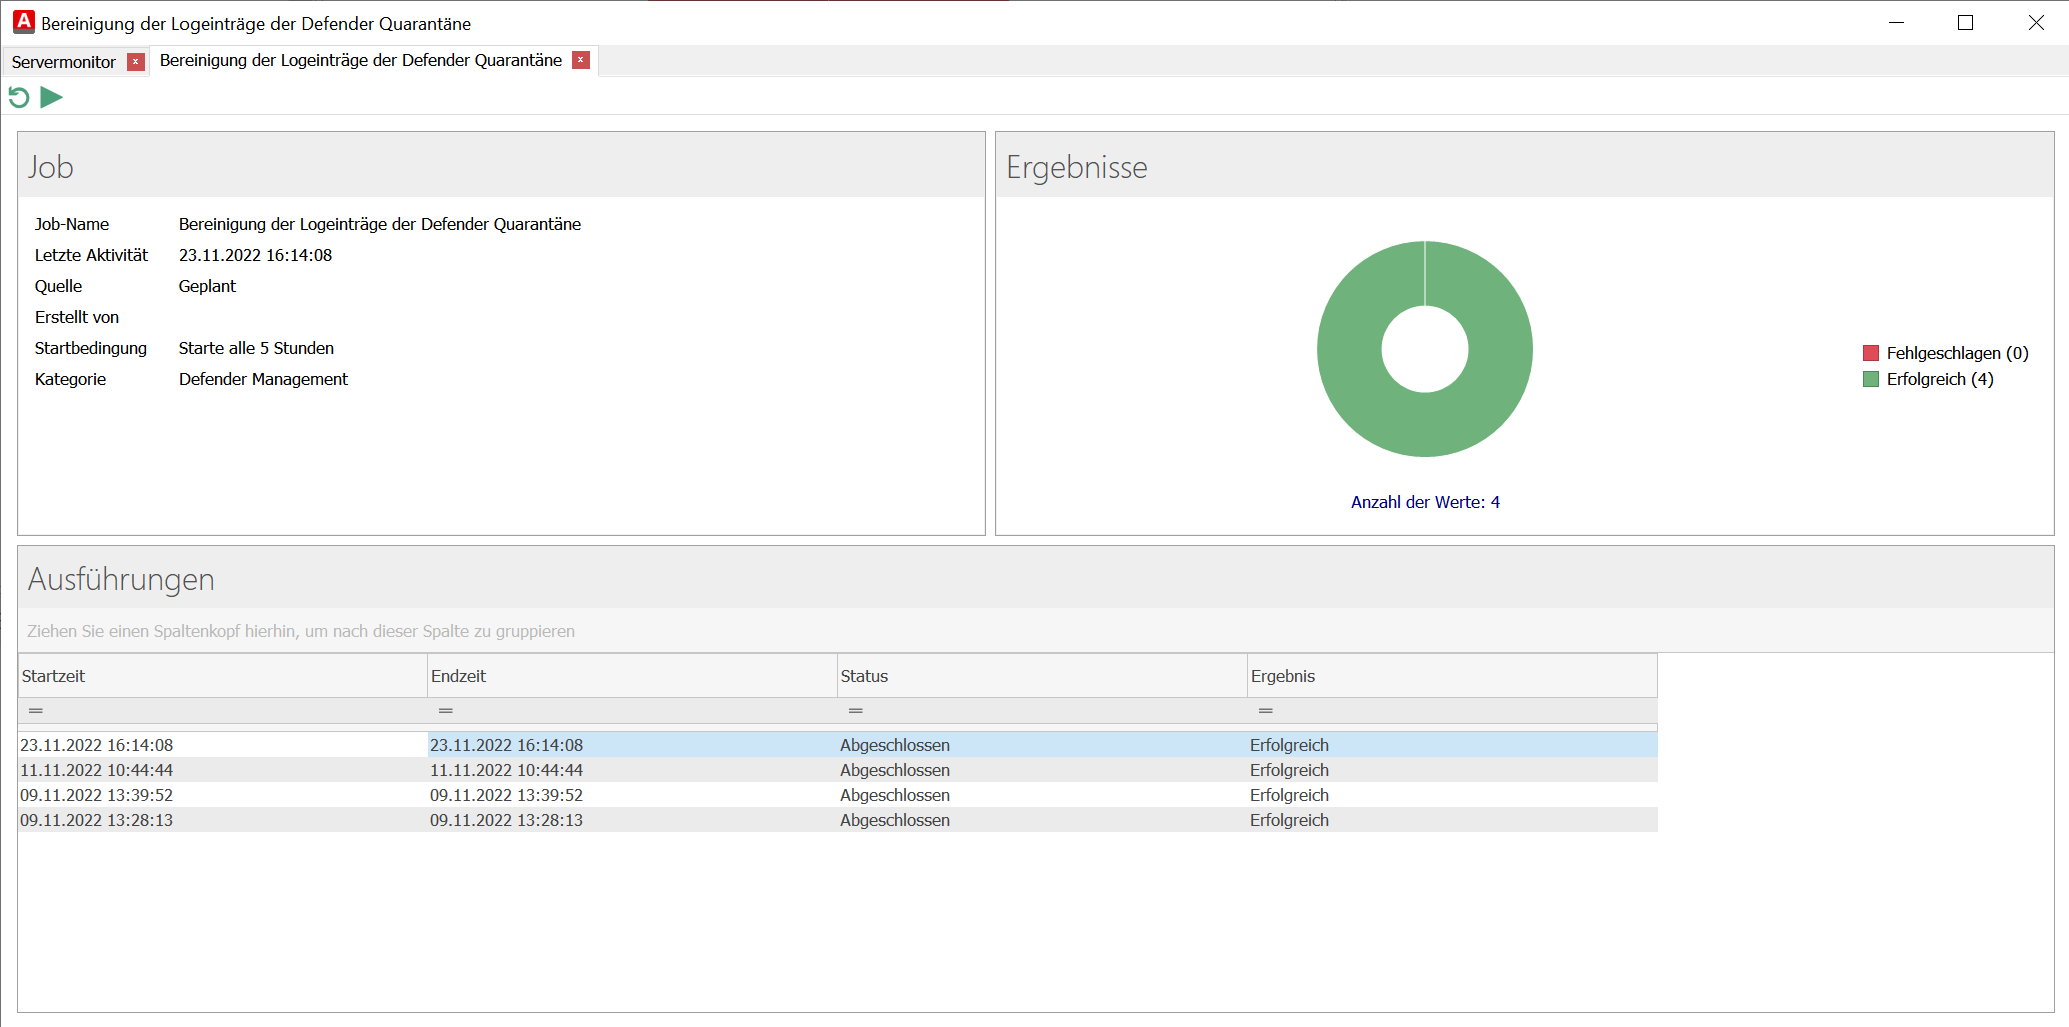
All executions of a specific Server job
If an execution fails, you can view the execution log by double-clicking on the execution. The log will contain a more detailed error message explaining why the execution failed.
Email Monitor
The Email Monitor displays any emails that the system has yet to send. If emails cannot be sent, for example because the mail server is offline, they will remain in this queue.
You can delete them by selecting the emails and clicking the Delete Emails icon.
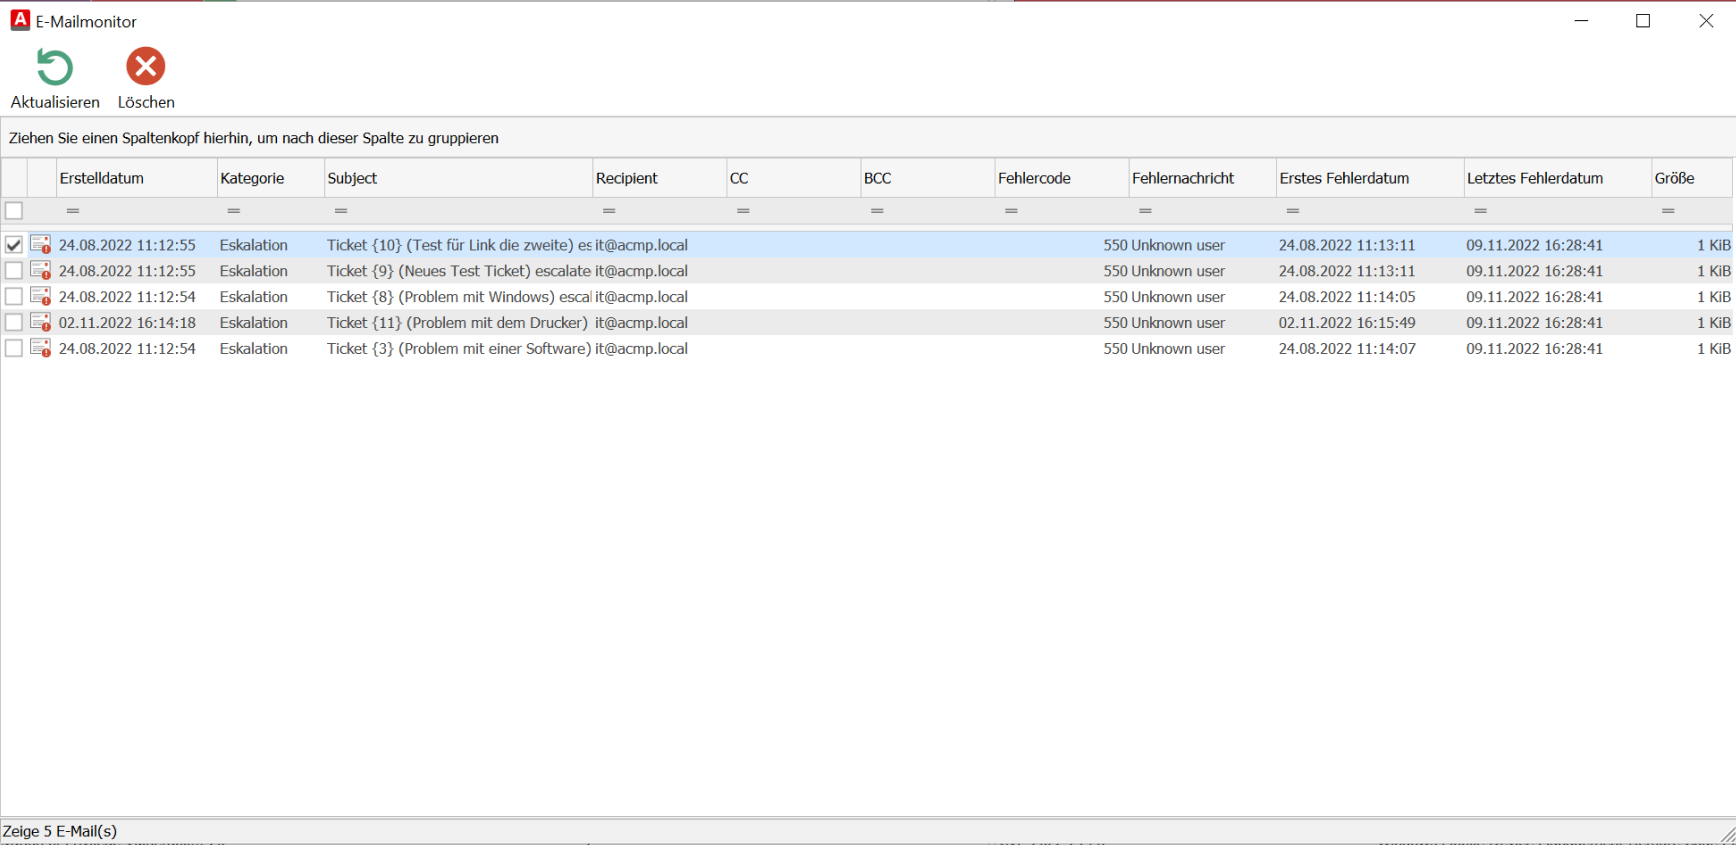
Emails in queue
Sync Monitor
The Sync Monitor provides an overview of all file repositories on the network and the status of data synchronisation.
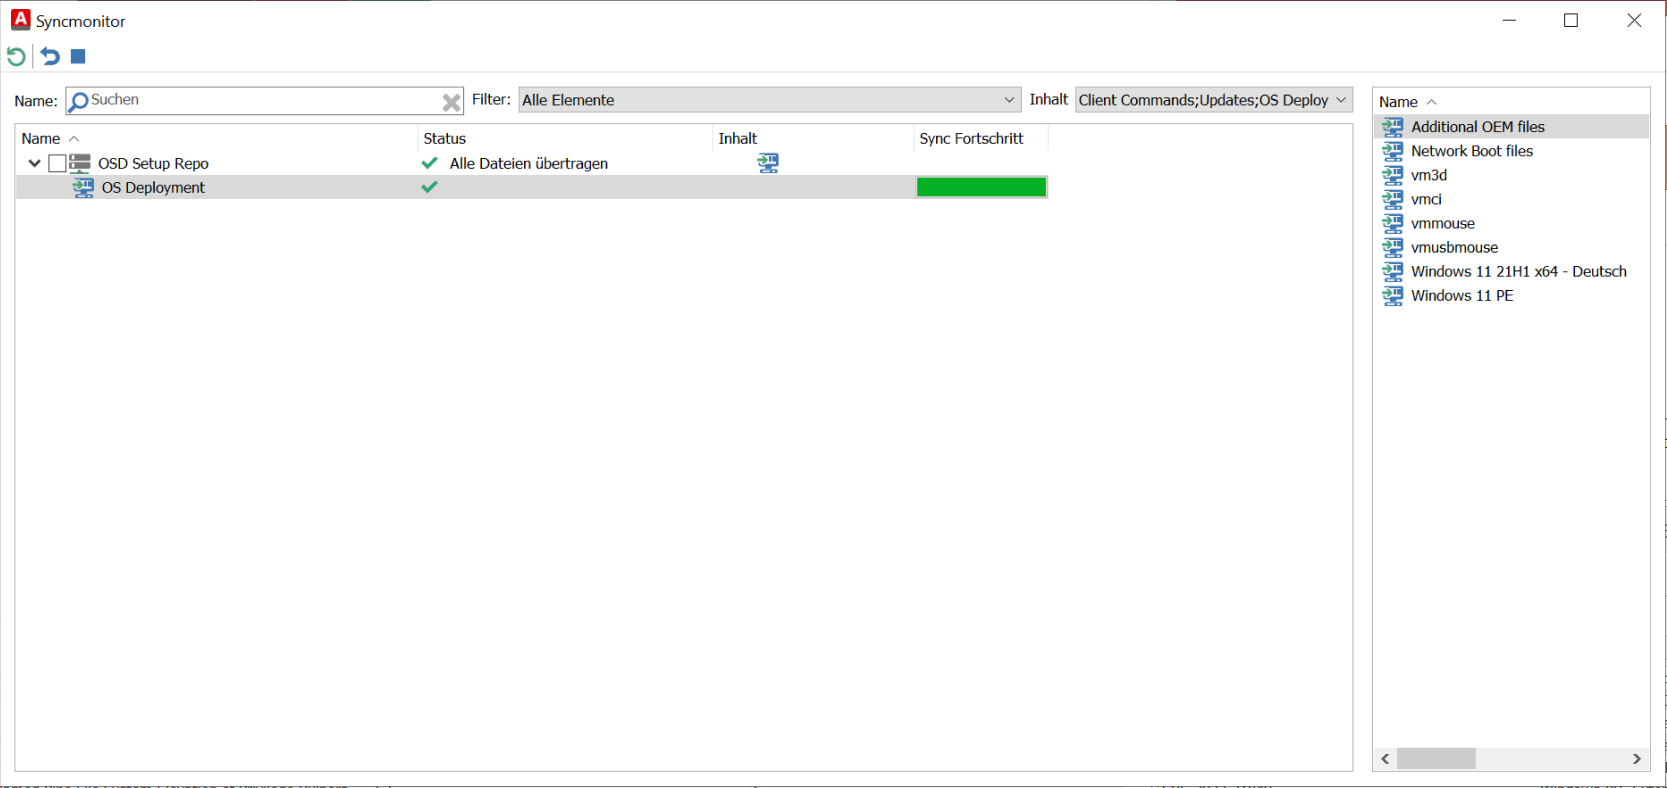
Sync Monitor
The file repositories are listed by type (Client Command/Client Update/OS Deployment), with the date and status displayed below each type. The status indicates how far the synchronisation process has progressed.
The data displayed can be updated directly by clicking the Refresh button.
The Start Sync and Stop Sync buttons can be used to pause and resume synchronisation of the selected file repositories. When resuming a paused synchronisation, a dialogue box allows you to specify whether only new data or all data from the first synchronisation should be transferred.