

Dashboards
In the ACMP Console, several plugins have so-called dashboards. The dashboards contain special widgets that provide an overview of the most important information for each plugin. The dashboards are displayed in different places with different widgets (e.g. in the Job Dashboard, Vulnerabilities Management, Helpdesk, License Management). They are dynamically adaptable and can be configured as you like.
Structure and function of the Dashboards
The dashboards in the various plug-ins all have an identical structure, consisting of the ribbon bar for configuring the dashboards and the workspace for setting up the widgets that contain the specific information. What makes the dashboards special is that you can set an individual interval for them, after which they update and display new changes (between 30 seconds and 15 minutes, as well as the function of deactivation).
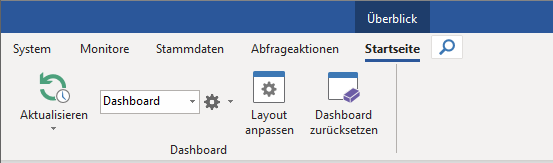
Dashboard area in the ribbon bar
| Name of function | Description |
|---|---|
| Refresh | Select the cycle in which the Dashboard should automatically update. |
| Drop-Down-Liste (Dashboard) | Selection of the Dashboard that is currently displayed in the workspace. |
| Configuration | Add and manage Dashboards for the current selected Plugin. |
| Customise layout | Opens the Layout Designer, where the appearance of the current Dashboard can be customised. |
| Reset Dashboard | Resets the current Dashboard back to its default appearance. |
Add a new dashboard
- Click the
icon on the ribbon bar.
- Select the Add new dashboard option.
- Type a name for the new dashboard.
- Confirm the name you have entered by clicking the OK button.
Your new dashboard is now added. You can now customise the layout of the dashboard.
Customise layout
Click Customise Layout in the ribbon bar to open the Layout Designer.
The appearance of the dashboard consists of three levels, which you can edit using the buttons in the ribbon bar:
- Level 1: Contains all groups present in the layout.
- Level 2: Individual groups that contain one or more subgroups and/or widget areas.
- Level 3: A widget panel contains a widget assigned to it in the dashboard.
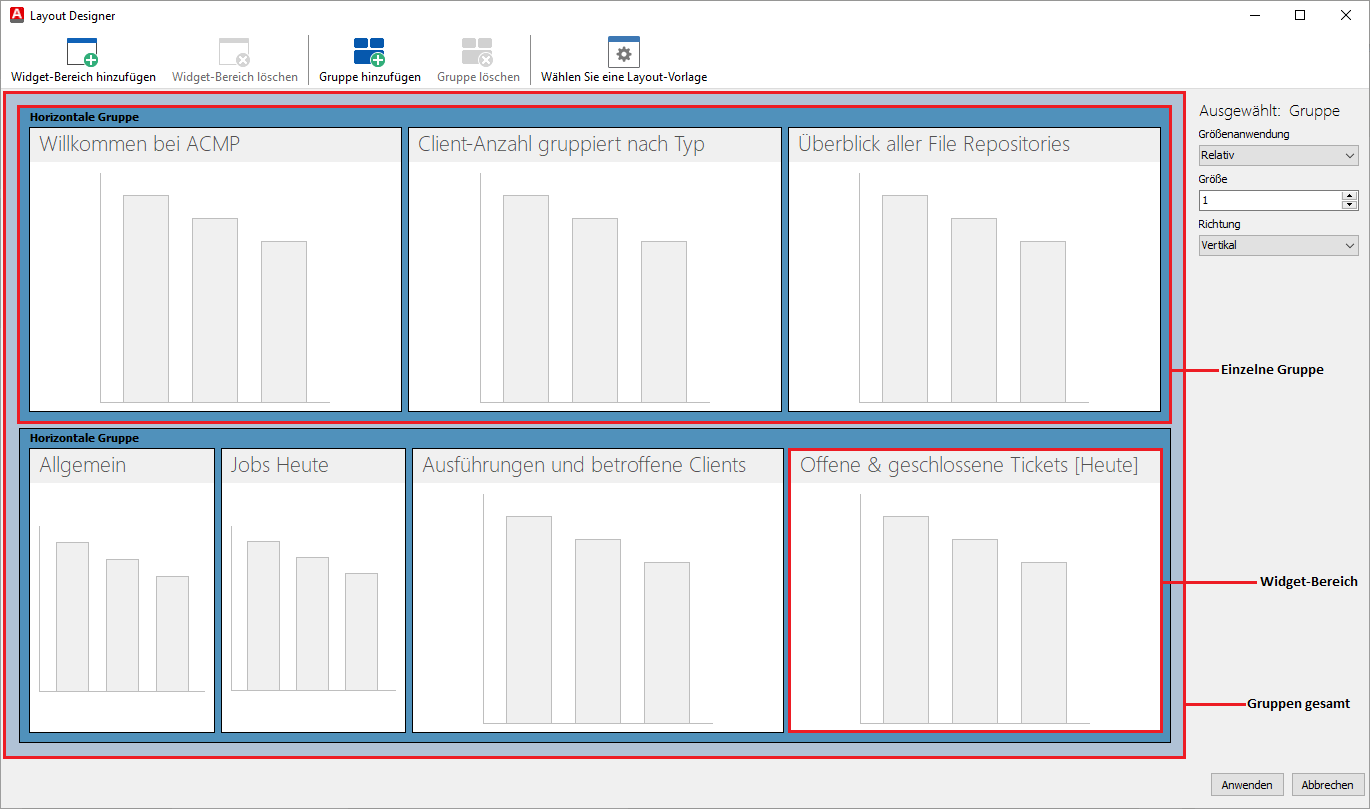
Layers in the Layout Designer
You can use the Select a layout template button to select one of the pre-made dashboard layouts. Alternatively, you can customise the layout of your dashboard by adding or deleting groups and widget areas. In the right menu bar, you can set the size of widget areas and groups relative to the window (relative) or absolute (unrelated), and whether groups should be arranged horizontally or vertically.
Once you have made all your adjustments, confirm your selection with the Apply button to apply the layout and close the Layout Designer.
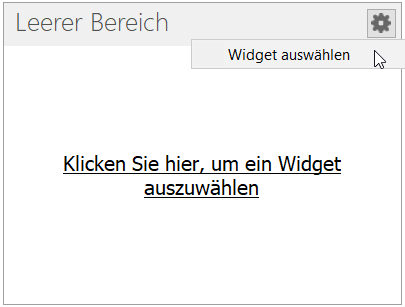
Selecting Widgets
When you have added a new dashboard or want to change the widgets of an existing dashboard, you can click on the text in the middle of a clear widget area in the workspace or on the icon to open the widget selector.
Adding a widget
To add a widget from the Widget Selector, double-click to select it and choose one of the available widgets from the list (e.g. Defender Management, Job Execution or Managed Software).