


Evaluating Queries
General information on evaluating a Query
After you have created and executed a query, the results are displayed in the Query Results. The results appear in a new vertical tab with the respective name of the query. The results are displayed in the grid, which displays the dates in tabular form according to the arrangement of the fields included in the query. For datasets containing a field with multiple values (e.g. several IP and MAC addresses of a machine), these multiple values are displayed in a sub-table. You can expand and collapse this table using the  /
/  buttons.
The respective icon in front of the dataset shows you how the associated client was inventoried.
| Symbol | Description |
| The Client was inventoried via the ACMP Agent | |
| The Client was detected by OneScanClient | |
| Client scanned by Agentless Scanner | |
| The Client was entered manually | |
| Client was inventoried via XML Importer (Linux) or via Linux Unit Agent | |
| Client was inventoried via XML Importer (Mac) or via Linux Unit Agent | |
| The Client was detected using the Network Boot Service | |
| This is a mobile Android Client | |
| This is a mobile iOS Client | |
| This is a Windows Mobile Client (Smartphone OS) |
Filtering Query Results
Query results can be filtered again to, for example, continuing to narrow them down or to create a better overview. To do this, navigate to the Filter Results (![]() ) in the quick-selection bar in the open query result. Left-click to open the action, which will cause the Filter Editor window to appear.
) in the quick-selection bar in the open query result. Left-click to open the action, which will cause the Filter Editor window to appear.
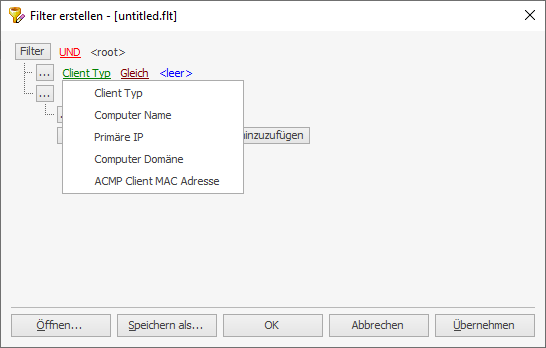
You can define additional filters within the filter editor. First, you can use the filter action field to add either a condition or a group. A condition opens one of the existing filters. To do this, simply select the appropriate list entry from the fields. You can also change the operator, which is set to equal to by default, by clicking on the entry and selecting a different one from the list. You can enter any comparison value in the <clear> field.
Filtering Query results
You can change the topmost operator (AND, OR, NOT AND or NOT OR) for a group that has been added. The conditions that are added after this are added after this operator, so that they must be fulfilled for the conditions.
You can use the individual comparison operators and fields to create completely individual filters. You can apply these directly as a filter for the open Query Result by clicking on the button of the same name. As soon as you have done this, the result will be re-filtered and updated. If you would like to reuse the filter for other Queries or at a later point in time, you can save it under Save as.... Please note that the active filter is saved as a.flt file. You can load a previously created filter using the Open... button. If you want to apply the filter directly, click on Apply and the grid view will be updated immediately. The filter window will remain open for possible changes. Otherwise, close the window by clicking on OK.
Exporting Query Results
You can also export the query results for other uses. To do this, click on Export Results (![]() ) in the quick-selection bar. A wizard will open to guide you through the export process. In the first step, select the rows of the datasets to be exported. You can choose from the following options:
) in the quick-selection bar. A wizard will open to guide you through the export process. In the first step, select the rows of the datasets to be exported. You can choose from the following options:
- Export all rows
- Export selected rows
- Export unselected rows
Once you have decided on the option, click Continuing >. On the following pages, you can specify the export format. Choose between the formats CSV or XML. If you choose the CSV format, you can select additional information. Specify whether the column name should be included or which symbols delimiters are used for the export (comma, semicolon, pipe or tab). These specifications are only required for the CSV format; they are not needed for XML. Then click Done and enter a file name and specify the storage location for the file.
Changing Queries and Refining Results
You can change query results or refine the results and customise them to your requirements. To do this, open the corresponding query and execute it. You can perform sorting in the results grid by moving the columns up and down using drag and drop. You can perform continuing filtering using the drop-down menu of the respective columns. All available values of the query and the column type are listed here, which you can select individually.
You can also drag the columns into the sort field. The results are grouped by the values above this. It is also possible to display several grouped columns directly. You can use the respective arrow on the right in the field ( ) to display the grouping in ascending or descending order. Sorting is done alphabetically.
The horizontal tabs are another way of customising the Query Results. These can be used to change the settings that you defined when creating the Query (see the Creating Queries section). The following tabs are available: Results, Fields, Filter, Security and Properties. You can use these to edit the respective changes for the Query.
Open and work with Client Details
You can view all the details for a selected client with just one click. The so-called client details provide you with information such as general fnformation, specific hardware and software data and assigned profiles.
You can either open the Client Details directly by double-clicking on a Client in a Query Result, or highlight one or more Clients, right-click to open the context menu and then click on Open Client Details.
The Client Details are always opened as a vertical tab for each respective Client. Each open Client Details tab contains its own machine name as a caption, so that a clear distinction is possible. The Client Details are organised in a tree structure. On the left side of the split window, you will find all categories with the respective query values. As soon as you have clicked on a category, the available values are displayed in the right window area, along with a detailed list of the fields.
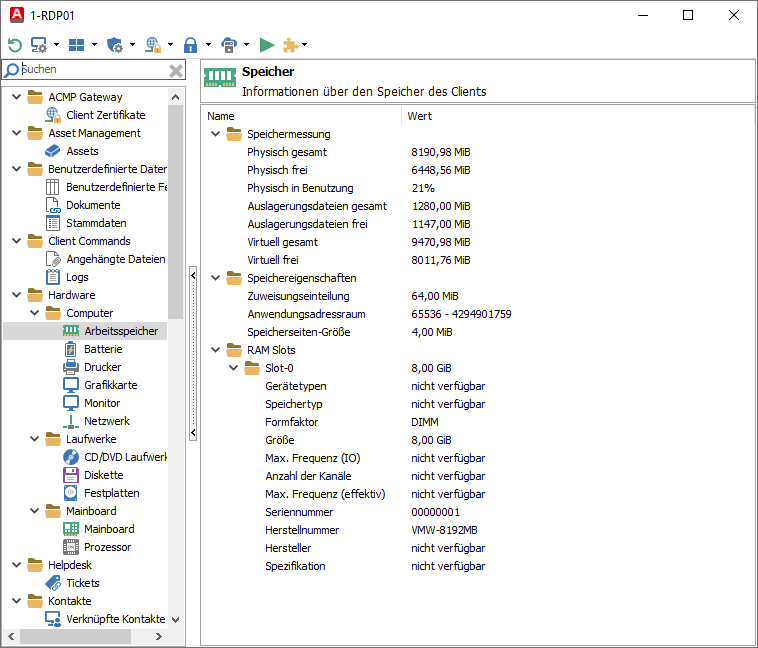
Client Details: Machine information
You have a small selection of options via the quick menu:
| Symbol | Description |
 | Updates the current window. If you change Clients, fields or filters in an already open Query, it is essential to update it so that the ACMP Server takes the changes into account. |
 | A submenu for managing your Clients will open. In the system selection, you have quick access to the most common query actions. |
 | A submenu for managing Windows Update Actions opens. In this menu, you can make specific changes from Windows Update Management and, among other things, install or uninstall Updates. |
 | Choose action Defender Management if you want to start a Defender Scan or Update via the quick access or assign or remove Configuration Profiles. |
 | You can create and distribute certificates for selected Clients or revoke them via the ACMP Gateway. |
 | You can use BitLocker Management to disable BitLocker or change drive passwords on selected Clients. In addition, you can also assign or remove Configuration Profiles. |
 | A submenu opens with all the Intune-specific actions that you can execute on a Client.. |
 | This opens a wizard for the execution of jobs. This allows you to distribute Client Commands, Job Collections, System Jobs, Managed Software or Windows Update Collections, which are then to be executed on the selected Clients. |
 | A submenu opens, in which the most frequently used Client Commands can be found. |
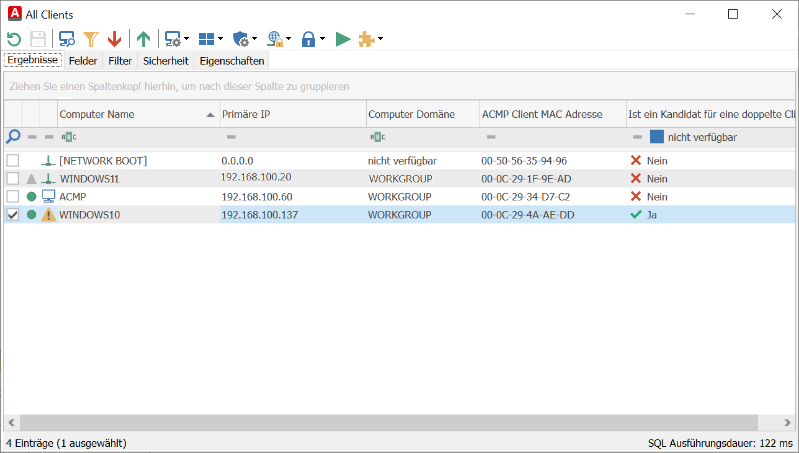
Special feature: Suspicious Clients in the system
If you come across a warning triangle icon in a query while working with ACMP, there are suspicious Clients in your system. A suspicious Client is a Client whose Client ID is not unique and is used by at least one other agent. Suspicious Clients can appear in all Client-based queries (e.g. in the containers, Assets or linked tickets).
Suspicious Client in the Client Details view
If multiple agents use the same Client ID, all these agents save their data under the same dataset in the database. This means that only the values of the last entered Client are displayed in a query. When entering scan data, the computer name is regularly overwritten by the agents. These changes are registered and saved. If a particular computer name is saved at least twice for a Client ID due to this name change, this Client ID is considered a suspicious Client. All computer names previously registered with this ID are then listed in the list of suspicious Clients in the Client Details.
When you open the Client Details for the suspicious Client, you will be taken automatically to the "Duplicate Client ID" (Software > Computer > Duplicate Client ID) where all previous computer names of the Client ID are listed.
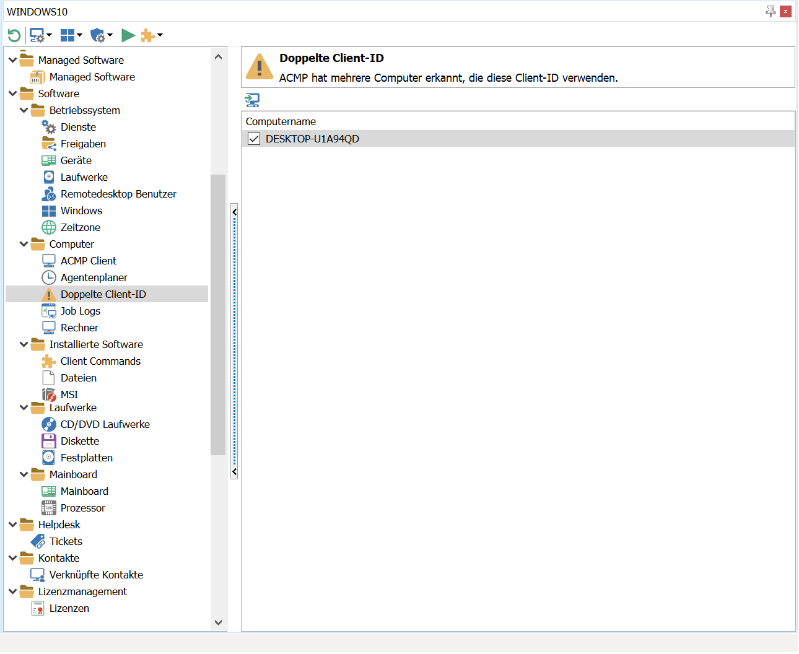
Client Details - Duplicate Client ID
You can select one or more entries directly from the Client Details and execute a new installation of the agent with a new Client ID on the computers of the agents to remove the suspicious Clients. The correction causes the entries to disappear from the list of Client IDs and the system no longer registers them as ‘suspicious’.
You can use the display field "Is a candidate for a duplicate ClientID" to build targeted Queries that automatically notify you of the occurrence of suspicious Clients.
Tree structure of the Client Details
You can use the tree structure to display individual areas of the Client. These are accessible via the Client Details. This allows you to retrieve the dates without having to create a new Query. In addition, hardware and software-specific data can be retrieved, which provides you with certain information.
| Area | Description | ||||||
| ACMP Gateway | In this section, you can check the Client certificates assigned for the ACMP Gateway and see which ones are in use. If you have assigned a certificate to the Client, you can also see the validity period, the status and the serial number from the entry. | ||||||
| Asset Management | In this area, you can create an Asset, edit an existing Asset or remove a Shortcut from the current Client, provided you have valid licenses for ACMP Asset Management. | ||||||
| Custom fields | All user-defined dates are stored in this area. These include custom fields, documents and Master Data.
| ||||||
| Client Commands | This area shows Client Command information that affects the Client.
| ||||||
| Hardware | This section provides a quick overview of the inventoried data of the Client, which is divided into the categories of computer, drives and mainboard. It is not possible to customise the data. | ||||||
| Helpdesk | This view lists all Helpdesk tickets for the Client. You can choose whether all tickets or only open tickets are displayed. | ||||||
| Contacts | Contacts linked to the Client are displayed here, where you can add, delete or reset shortcuts. | ||||||
| Licence Managament | This section shows you which licences are being used by the Client. It is not possible to customise this. | ||||||
| Managed Software | This entry allows you to display the Managed Software of this Client and manage items. | ||||||
| Mobile Device Management | This is where you can find information about the inventoried mobile device. It provides general information as well as specific information about the hardware, the SIM card or the network. | ||||||
| Software | This section contains all the information about the software available on the Client. For this purpose, details about the operating system, the computer and the installed software are displayed. The OS Deployment section provides you with an overview of the assigned values, while the Security section can be used to display vulnerabilities and the BitLocker and Defender Management. | ||||||
| Virtualization | In this area, you can set the virtualisation options for the selected Client. In the upper area, you determine whether the Client is running on a physical host or in a virtual machine. These are then displayed in an overview and can be marked as backup or failover. The lower area allows you to define in which virtual machines the Client is running. The information is automatically filled in by the VMware vSphere scanner if you have configured this in the settings (Settings > ACMP Server > Virtualisation). | ||||||
| Windows Update Inventory | In this area, you can view the Windows Updates that are installed and available for the Client, as well as the Windows Update Logs. The Windows Update Logs are logged in full so that you can also view them. You can use the options to save or delete these logs. | ||||||
| Windows Update Management | In this section, you can have ACMP manage Windows Updates. The already installed, not installed and failed updates are displayed. You can also specify whether declined updates should be hidden or displayed. You have the option to update the log files (install selected updates) or delete them (uninstall selected updates). |