


Working with the Report Builder
In this section, we will add some advanced features to a report. We will insert elements such as a page header and an extended page footer into the report we have already created. The data will also be grouped by domain, and the items in each group will be counted again.
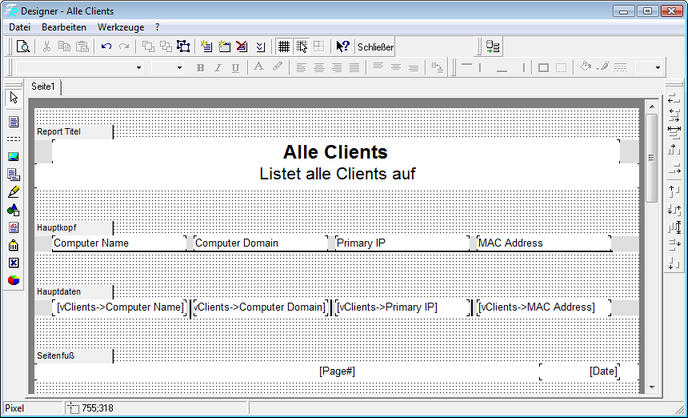
The figure shows the initial setup for this section. The width and height of the rectangle objects were customized to display the data optimally. In addition, various lines were inserted using the Draw Line tool to visually separate the data.
Add a Page Header
In the current report, the data is displayed in a table. With a large number of Clients, this table spans multiple pages. However, the column descriptions appear only on the first page. We now want to change this.
To do this, use the Insert Area tool. Place the new area above the Main Header area. In the selection dialog that appears, choose Page Header. A new area will be inserted into the report. If necessary, move the other areas further up or down to make room for the new area.
Select the newly created area and increase its height. To do this, click on it and drag one of the border points to the desired size. You can then drag and drop the rectangle objects from the “Main Header” to the “Page Header.” Be sure to include the line that will serve as the divider. Finally, delete the “Main Header” section. The following figure shows the newly created section.

Once the page header has been created as shown in the illustration, the description of each column—including the dividing line—is restated on every page.
Add a Footer
To display the current page number and the current date at the bottom of each page of the report, a footer has already been automatically inserted. As the name suggests, this section is inserted at the end of each page.
The automatically created area already contains two rectangle objects. One spans the entire width of the area and contains a variable that displays the current page number. The second rectangle object is located on the right margin and contains a variable that displays the current date.
To supplement the existing data, double-click the large rectangle object. The input field for the rectangle object’s caption will open. Here you’ll find the entry [Page#]. You should now add the total number of pages to this. To do so, enter a “of” or a “/” after the variable, for example. Then click the “Insert Printout” icon. You can insert possible variables using the new dialog box.
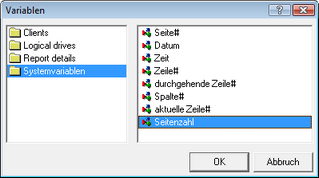
Select the “System Variables” category, then select the “Page Number” variable. Click OK to return to the input field. The variable [TOTALPAGES] has now been inserted here. Confirm your entry, and you will return to the actual report. To ensure that the page number is displayed correctly in the preview, you must set one more option. From the File menu, select Report Options and check the option “2 passes per report.”

The figure above shows the newly configured page footer. In addition to the current page number and the date, the total number of pages has been inserted. This process can occur repeatedly for any input or variables. You can even include graphics, such as your company logo.
Creating Groupings
To maintain an overview of a large amount of data, the data can be grouped by a specific attribute, for example. To do this, the report data will now be grouped by computer domain. The Group Header and Group Footer sections are designed for this purpose.
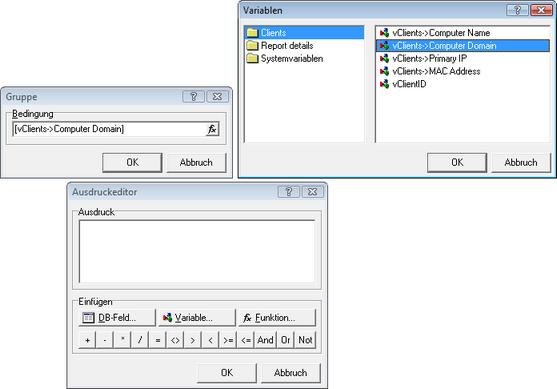
Insert a new section above the main data in the report. Select “Group Header” as the section type. A dialog box will now prompt you to specify the attribute by which the data should be grouped. Click the formula icon to the right of the input field. The expression editor will open. Click the “Variable” button here.
In the next dialog box, select the “Clients” criterion and select the variable “vClients->Computer Domain.” Confirm all three dialogs in sequence. The “Group Header” section is now inserted automatically. You can use drag-and-drop to reposition the other sections to make enough room for the new section.
You now have two options for continuing. Since you have already specified a page header that contains the column descriptions, you can set the height of the group header to a minimum. This way, the column descriptions would remain on every page, but all Clients would simply be listed one after another in sorted order.
A more elegant method is to display the data in visually grouped columns. To do this, increase the height of the group header and drag the column labels from the page header into the group header. The indented line will be moved along with them. The page header can be deleted. The individual groups are now visually separated as well.
To clearly label the data, you can now position the rectangle object labeled “Computer Domain:” above the other column captions. Right next to it, place the rectangle object labeled “[vClients->Computer Domain]” from the main data area into the group header. The widths of all other rectangle objects can then be customized to close the resulting gap. The following figure shows the result:

With this configuration, the domain name is displayed above each group. Directly below that are the captions for the individual columns. Below this section, all Clients belonging to the specified domain are listed. The preview shows the result:
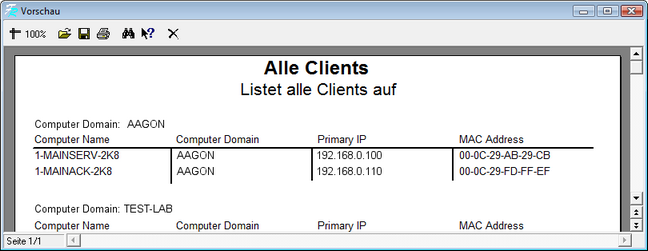
If this overview is not enough for you, you can have the Clients for each domain listed on a separate page. To do this, select the group header and open the Object Inspector. Press the F11 key or go to the menu: Tools -> Toolbars -> Object Inspector. Select the FormNewPage property and set its value to true. Each new grouping will now appear on a new page.
Specify the Number of Group Elements
The clients are now displayed in groupings in the report. To specify how many clients are in each grouping, you can create a group footer. This section is inserted below each grouping. There, you can define an appropriate function.
Use the Insert Section tool to create a section below the main data section. Select the “Group Footer” area. Use drag-and-drop to move the footer down slightly to create enough space.
Next, create a rectangle object in the new area. Enter text such as “Count: [Count(MasterData0)]” here. The variable [Count(MasterData0)] consists of the Count function, which counts the elements in an area. The “Main Data” area is specified as the range. This is done using the area’s internal name, which you can find using the Object Inspector. To do this, select the “Main Data” area and open the Object Inspector. The internal name is located in the top drop-down list and, in this case, is specified as “MasterData0.”

By creating the rectangle object in the group footer, the number of entries for each group is determined. You could also integrate the rectangle object into the page footer. In that case, all items on a page would be determined. All listed items would then be displayed in the report summary section.
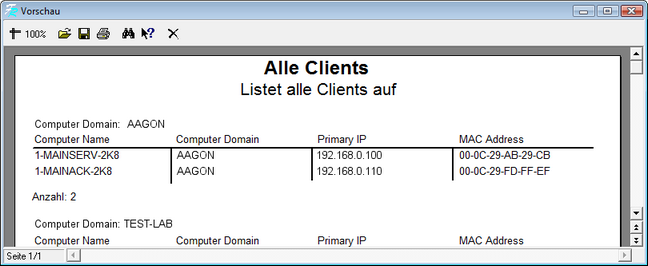
To ensure that the data is calculated correctly in the preview, you must select the option “2 runs per report” via the File -> Report Options menu. The following figure shows the preview as it was created using the configuration described above.